
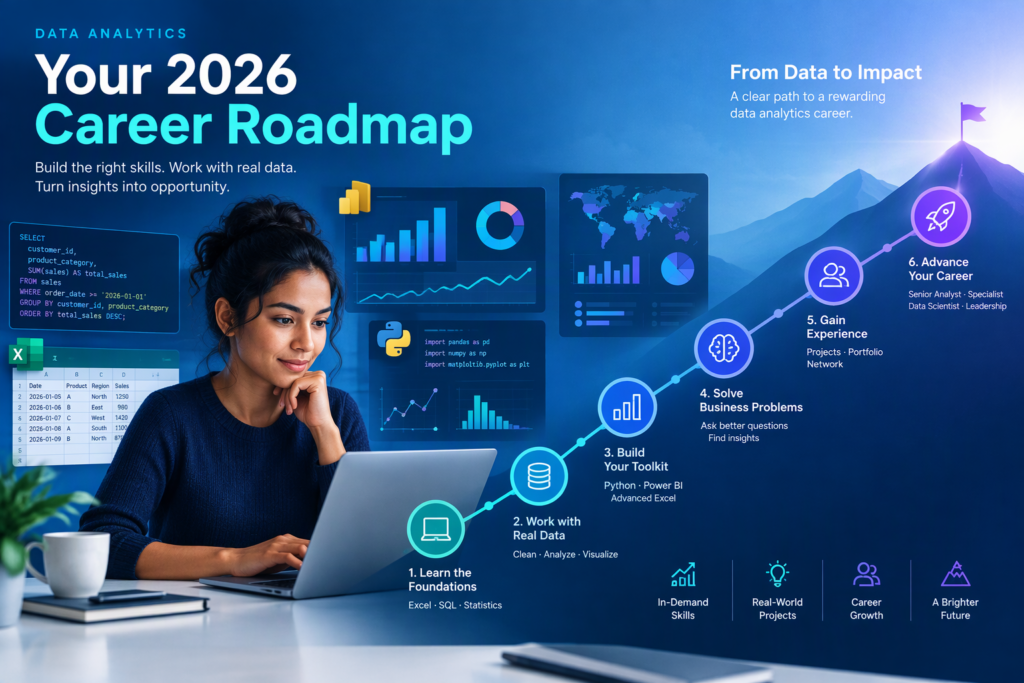
How to Become a Data Analyst in 2026: Complete Roadmap, Skills, Tools & Career Guide
Want to become a Data Analyst but don’t know where to start?
You don’t need advanced programming knowledge or a background in machine learning to begin learning data analytics.
A practical path starts with Excel, SQL, Power BI and basic statistics, followed by Python, real-world projects and portfolio development.
Whether you’re a BCA student, BCom graduate, engineering student, working professional or someone exploring a new career, the key is to follow a structured learning plan and apply what you learn.
In this complete Data Analyst Roadmap for 2026, you’ll discover:
- What Data Analysts do in real organizations.
- The essential skills and tools to learn.
- A step-by-step roadmap for beginners.
- Practical projects that demonstrate your abilities.
- Career opportunities for aspiring Data Analysts in India.
- How structured training and practical experience can support your learning.
Let’s begin with the fundamentals.
What Is Data Analytics?
Data Analytics is the process of collecting, cleaning, organizing, examining and interpreting data to answer questions and support better business decisions.
Consider a retail company operating across multiple cities. Its management wants to know:
- Which products generate the most revenue?
- Which stores are performing below expectations?
- Why did sales decrease last month?
- Which customers make repeat purchases?
- How can inventory planning improve?
A Data Analyst investigates these questions using business data.
For example, an analyst may discover that a store’s revenue declined because popular products were frequently unavailable.
After validating the findings, the analyst can recommend changes to inventory planning.
Data analytics is therefore much more than creating graphs or dashboards.
The real value of data analytics lies in converting reliable data into meaningful insights and actionable recommendations.
What Does a Data Analyst Do?
A Data Analyst helps organizations understand performance, identify problems and make evidence-based decisions.
Responsibilities vary between industries, but commonly include:
- Collecting information from spreadsheets, databases and business applications.
- Cleaning missing, duplicated and inconsistent records.
- Writing SQL queries to retrieve and combine data.
- Performing calculations and identifying trends.
- Creating reports and dashboards in Excel or Power BI.
- Monitoring key performance indicators (KPIs).
- Communicating findings to managers and business stakeholders.
A Typical Day in the Life of a Data Analyst
Imagine a company’s sales manager asks:
Why did revenue decrease in our western region last month?
A Data Analyst might follow this process:
Step 1 — Retrieve data: Use SQL to collect sales records for the relevant period.
Step 2 — Check data quality: Review missing transactions, returns, duplicate records and inconsistent dates.
Step 3 — Calculate metrics: Compare revenue, order volume, average order value and product performance.
Step 4 — Build visualizations: Use Power BI to compare sales across regions, products and months.
Step 5 — Explain findings: Present the results, identify possible causes and recommend further investigation or corrective action.
This illustrates an important principle:
Technical tools support data analysis, but business understanding determines whether the results are useful.
Why Consider a Career in Data Analytics?
Organizations in many industries use data to monitor operations and evaluate business decisions.
Data Analytics skills are relevant across several sectors.
| Industry | How Data Analytics Is Used |
|---|---|
| Retail & E-commerce | Sales analysis, inventory planning, customer segmentation |
| Banking & Finance | Financial reporting, budgeting, operational risk analysis |
| Healthcare | Resource utilization, operational reporting, service performance |
| Manufacturing | Production efficiency, quality monitoring, downtime analysis |
| Information Technology | Product analytics, application usage, customer retention |
| Logistics & Operations | Delivery performance, resource planning, process improvement |
| Marketing | Campaign performance, conversion analysis, customer behaviour |
This variety makes Data Analytics a useful career field to explore.
However, job requirements depend on the organization, role and experience level.
Learning one tool does not guarantee employment. Employers may evaluate analytical thinking, technical skills, communication and the ability to explain completed projects.
Step-by-Step Data Analyst Roadmap for Beginners in 2026
If you’re wondering how to become a Data Analyst from scratch, follow this practical learning sequence.
Excel → SQL → Power BI → Statistics → Python → AI-Assisted Analytics → Projects → Portfolio & Interview Preparation
You can adjust the order slightly depending on your academic background, but the key is to build a foundation before moving to complex tools.
Step 1: Learn Excel for Data Analytics
Microsoft Excel is an excellent starting point because it introduces structured data, calculations, reporting and business metrics.
Important Excel skills:
- Data sorting and filtering.
- Tables and structured references.
- SUM, COUNT, AVERAGE and IF.
- SUMIFS and COUNTIFS.
- XLOOKUP and related lookup techniques.
- Text and date functions.
- Data validation.
- Duplicate identification.
- PivotTables and PivotCharts.
- Conditional formatting.
- Basic dashboards.
Practical project: Create a monthly sales reporting workbook that shows total revenue, product performance and regional sales trends.
By the end of this stage, you should be able to turn an unorganized spreadsheet into a reliable business report.
Step 2: Learn SQL for Data Analysts
SQL, or Structured Query Language, is used to work with relational databases.
Many organizations store important business information in database systems rather than individual spreadsheets.
Learning SQL helps you retrieve, combine and summarize that information.
Essential SQL topics:
- Database tables and relationships.
- SELECT and WHERE.
- ORDER BY.
- GROUP BY and HAVING.
- COUNT, SUM and AVG.
- INNER JOIN and LEFT JOIN.
- CASE expressions.
- Subqueries.
- Common Table Expressions (CTEs).
- Window functions such as ROW_NUMBER and RANK.
Practical project: Create customer, product and order tables, then write queries to identify top-selling products, repeat customers and regional performance.
Step 3: Learn Power BI for Data Visualization
Microsoft Power BI is a business intelligence platform used to create interactive reports and dashboards.
It helps analysts present data in a format that business users can explore.
Important Power BI concepts:
Power Query: Importing, cleaning and transforming data.
Data Modeling: Creating relationships between fact tables and dimension tables.
DAX: Writing calculations for revenue, margins, growth and other measures.
Reporting: Building charts, KPI cards, tables, slicers and drillthrough views.
Dashboard Design: Choosing appropriate visuals and communicating insights clearly.
Practical project: Build a sales dashboard showing total revenue, monthly trends, product performance and regional comparisons.
Avoid focusing only on attractive charts. A strong dashboard should contain accurate calculations, useful metrics and an understandable business story.
Step 4: Understand Basic Statistics
Statistics helps Data Analysts interpret information correctly.
For beginner-level analytics, focus on:
- Mean, median and mode.
- Percentages and growth rates.
- Range and variance.
- Standard deviation.
- Distributions and percentiles.
- Correlation.
- Outliers.
- Sampling and basic uncertainty.
Example: Suppose average sales increase, but most stores report declining revenue.
A few exceptionally high-performing stores may be affecting the average.
Comparing the mean, median and distribution can provide a more complete picture.
Practical project: Compare sales performance across five branches using averages, medians and variation.
Remember that correlation does not automatically prove causation.
Step 5: Learn Python for Data Analytics
Python is valuable for automating repetitive analysis, working with larger datasets and creating reproducible data-processing workflows.
Start with programming fundamentals:
- Variables and data types.
- Lists and dictionaries.
- Loops and conditional statements.
- Functions.
- File handling.
- Basic error handling.
Then explore popular data analysis tools.
Jupyter Notebook: An interactive environment for running code and documenting findings.
NumPy: A library for numerical calculations and arrays.
Pandas: A library for manipulating tabular data.
Matplotlib: A library for visualizing data.
With Pandas, practise importing CSV files, cleaning data, filtering records, calculating summaries and combining datasets.
Practical project: Import a customer transactions dataset and create a notebook explaining purchasing patterns.
Step 6: Explore AI-Assisted Data Analytics
Artificial Intelligence can assist analysts with selected tasks, such as:
- Explaining unfamiliar SQL queries.
- Suggesting Excel formulas.
- Helping debug Python code.
- Drafting reporting documentation.
- Recommending data-quality checks.
- Exploring alternative approaches to analysis.
However, AI-generated results may contain incorrect formulas, assumptions or interpretations.
Always check calculations against your actual data.
Never upload confidential customer or company datasets to an AI tool unless you have authorization and an approved data-handling process.
AI should support analytical work, not replace independent verification and critical thinking.
Step 7: Build Practical Data Analytics Projects
Learning syntax and watching tutorials are not enough.
Projects provide an opportunity to demonstrate how you approach real analytical problems.
Each project should include:
- A clearly defined business question.
- A suitable dataset.
- Data cleaning and validation.
- Analytical methods.
- Calculations and visualizations.
- Findings and limitations.
- Actionable recommendations supported by evidence.
Focus on completing a few well-documented projects rather than accumulating unfinished exercises.
Step 8: Create Your Portfolio and Prepare for Interviews
A Data Analytics portfolio helps demonstrate practical skills to potential employers.
Include:
- Excel reporting workbooks.
- SQL scripts.
- Power BI dashboard screenshots or authorized shared reports.
- Python notebooks.
- Project explanations.
- Data-quality and validation notes.
- Key findings and recommendations.
GitHub can be useful for storing SQL and Python projects, while a personal website or LinkedIn profile can present project summaries.
Prepare for interviews by practising:
- SQL joins and aggregations.
- Excel formulas.
- Power BI data models.
- DAX calculations.
- Basic statistics.
- Dashboard design.
- Business case questions.
Be ready to explain your decisions, not just describe the software you used.
Want to learn these skills through a structured curriculum?
Explore the Professional Data Analytics Career Program at Educora Technologies, covering Excel, SQL, Power BI, Python, practical projects and AI-assisted analytics.
Essential Tools and Skills for Data Analysts
Beginners often wonder which Data Analytics tools are most important.
Here is a practical comparison.
| Tool / Skill | Main Purpose | Beginner Priority | Example |
|---|---|---|---|
| Microsoft Excel | Spreadsheet analysis | Essential | Sales reporting |
| SQL | Database querying | Essential | Customer-order analysis |
| Power BI | Dashboards and BI reporting | High | Management KPI dashboard |
| Basic Statistics | Data interpretation | Essential | Comparing business performance |
| Python | Programmable analysis | High after foundations | Automated data cleaning |
| Pandas | Python data manipulation | High with Python | Combining datasets |
| AI Assistants | Workflow support | Supporting | Explaining query logic |
| Tableau | Alternative BI platform | Optional initially | Interactive reports |
You do not need to master every tool before applying for your first relevant opportunity.
For many entry-level reporting and analytics paths, Excel, SQL and a business intelligence tool provide a practical technical foundation.
Python and AI-assisted workflows can expand your capabilities as you progress.
Best Data Analytics Projects for Beginners
Practical projects are especially useful because they combine technical knowledge with problem-solving.
Here are four project ideas suitable for beginners.
Project 1: Excel Sales Reporting Dashboard
Business question: Which regions and products generate the highest sales revenue?
Dataset: A fictional or appropriately anonymized retail sales dataset.
Tools: Excel, formulas, PivotTables and charts.
Activities:
- Clean sales records.
- Standardize date formats.
- Calculate revenue and order metrics.
- Compare products and regions.
- Build a reporting dashboard.
Expected deliverable: A reusable Excel workbook and short summary of findings.
Skills demonstrated: Excel formulas, data cleaning, reporting and business interpretation.
Project 2: SQL Customer and Sales Analysis
Business question: Which customers generate the highest completed-order revenue?
Dataset: Customer and order tables in a relational database.
Tools: SQL and PostgreSQL or a comparable database.
Example query:
SELECT
    c.customer_id,
    c.customer_name,
    SUM(o.order_amount) AS total_revenue
FROM customers AS c
JOIN orders AS o
    ON c.customer_id = o.customer_id
WHERE o.order_status = 'Completed'
GROUP BY
    c.customer_id,
    c.customer_name
ORDER BY total_revenue DESC;
This query combines customer and order data, calculates completed-order revenue for each customer and sorts customers by total revenue.
It assumes order_amount represents the revenue to be counted and that the sample schema contains the displayed columns.
Expected deliverable: SQL scripts and a written summary of customer performance.
Skills demonstrated: Joins, filtering, aggregation and query interpretation.
Project 3: Power BI Business Performance Dashboard
Business question: How is company performance changing across months, products and regions?
Dataset: Sales transactions, product records and date information.
Tools: Power BI, Power Query and DAX.
Activities:
- Import and validate datasets.
- Build table relationships.
- Create measures.
- Design KPI cards.
- Display monthly trends.
- Add slicers for interactive filtering.
Example DAX measure:
Total Revenue = SUM(Sales[Revenue])This measure calculates the total of the numeric Revenue column in the Sales table while respecting the applicable filter context.
Expected deliverable: An interactive Power BI report containing KPIs, trends and comparisons.
Skills demonstrated: Data modeling, DAX, visual reporting and dashboard design.
Project 4: Python Exploratory Data Analysis
Business question: What patterns and data-quality issues exist in customer purchasing behavior?
Dataset: A fictional or appropriately anonymized customer transaction dataset.
Tools: Python, Pandas, Jupyter Notebook and Matplotlib.
Activities:
- Import the dataset.
- Examine missing values.
- Review and standardize data types.
- Identify inappropriate duplicates.
- Calculate summary statistics.
- Visualize customer behavior.
- Explain limitations and findings.
Expected deliverable: A documented Jupyter notebook and short analysis report.
Skills demonstrated: Python, data cleaning, statistics, visualizations and interpretation.
When showcasing these projects publicly, identify synthetic datasets clearly. Do not present fictional examples as real business results.
Can Non-IT Students Become Data Analysts?
Yes. Students from non-IT backgrounds can learn Data Analytics, although their starting points and preparation requirements may differ.
BCom and BBA Graduates
Commerce and business graduates may already understand accounting, sales reporting, financial statements and business metrics.
These skills can support their transition into analytics when combined with SQL, Excel and visualization.
BCA and MCA Students
Computer application students may be familiar with programming concepts and databases.
They should also focus on analytical reasoning, dashboard design and business communication.
BSc Graduates
Depending on their specialization, BSc students may have exposure to mathematics, statistics or scientific data analysis.
They can extend those skills by learning business intelligence and SQL.
Engineering Graduates
Engineering students may find technical and mathematical concepts familiar, but still need to learn how to communicate findings in business terms.
MBA Graduates
MBA graduates may already have experience with business cases, management reporting and decision-making.
They can strengthen their analytical capabilities through practical data tools.
A specific degree alone does not guarantee readiness.
Successful learning requires consistent practice, problem-solving and the ability to interpret results accurately.
Common Mistakes Beginners Should Avoid
1. Learning too many tools at once
Start with a manageable learning sequence before exploring additional platforms.
2. Memorizing code without understanding it
Practise solving real analytical problems instead of copying syntax blindly.
3. Creating dashboards without understanding the data
Always verify source information, calculations and business definitions.
4. Ignoring data quality
Incorrect dates, duplicates and missing values can produce misleading results.
5. Misinterpreting statistics
Understand the difference between correlation and causation. Examine context before recommending action.
6. Relying entirely on AI-generated answers
Review AI-generated SQL, formulas and Python code before using the results.
7. Applying for jobs without project evidence
Completed, documented projects can help demonstrate your skills and decision-making process during interviews.
Data Analyst Career Opportunities in India
Data Analytics skills can support several entry-level career paths.
| Career Role | Typical Responsibilities |
|---|---|
| Data Analyst Trainee | Data cleaning, reporting and supervised analysis |
| Junior Data Analyst | Queries, dashboards and business reporting |
| MIS Executive / Analyst | Operational reporting and management information |
| Reporting Analyst | Regular performance and analytical reports |
| Business Intelligence Analyst Trainee | Dashboard development and BI data modeling |
| Junior Power BI Developer | Power BI reports, data models and DAX measures |
| Data Quality Analyst Trainee | Data checks, validation and quality improvement |
| Operations Analytics Associate | Operational metrics and process reporting |
Actual job responsibilities vary between employers.
Candidates should review individual job descriptions and required experience rather than relying only on job titles.
Employment is not guaranteed. Opportunities depend on technical skills, practical experience, available positions and employer selection.
How Long Does It Take to Learn Data Analytics?
There is no single learning timeline that works for everyone.
The time required depends on:
- Your existing technical knowledge.
- Your background in mathematics and spreadsheets.
- The number of hours you practise.
- Your ability to complete projects independently.
- The level of proficiency required for your intended role.
For beginners, the following is an illustrative 12-week foundation roadmap:
| Week | Learning Focus |
|---|---|
| 1–2 | Excel, reporting and Power Query foundations |
| 3–4 | SQL and relational database analysis |
| 5–6 | Power BI, data modeling and DAX |
| 7–8 | Dashboard development, BI concepts and statistics |
| 9–10 | Python, Pandas and exploratory analysis |
| 11 | AI-assisted analytics and workflow validation |
| 12 | Integrated project, portfolio and interview preparation |
This schedule is an illustrative learning structure, not a guarantee of job readiness.
Some learners will need additional time to strengthen their problem-solving skills, complete independent projects and prepare for interviews.
Consistent practice is more valuable than rushing through a syllabus.
Structured Data Analytics Training at Educora Technologies
Self-learning is possible, but structured training may help learners follow a clear curriculum, practise consistently and receive expert feedback.
Educora Technologies offers a Professional Data Analytics Career Program focused on practical analytical skills and business reporting workflows.
The published curriculum includes:
- Excel and Advanced Excel.
- SQL.
- Power Query.
- Power BI and DAX.
- Data modeling and reporting.
- Python and Pandas.
- Basic statistics and visualization.
- AI-assisted analytics.
- Practical projects and an integrated capstone.
Program Structure
The published program describes:
3 Months of Technical Training + 3 Months of Company Internship
The training phase focuses on technical foundations, guided assignments, projects and practical evaluation.
The following internship phase is intended to provide supervised exposure to data operations, BI reporting and analytics delivery.
Prospective learners should confirm internship eligibility, company arrangements, work mode, timing, documentation and any applicable stipend with Educora before enrolling.
Who Can Apply?
The program is intended for suitable learners from backgrounds including:
- BCA and MCA.
- BSc and BCom.
- BBA and MBA.
- BE/BTech.
- Comparable academic backgrounds.
- Early-career professionals interested in analytics.
Basic computer literacy, school-level arithmetic and willingness to practise are useful starting requirements.
Explore the Program
Discover the curriculum, practical learning approach, projects and program details.
Explore Professional Data Analytics at Educora Technologies
You can also check the upcoming Batch Schedule for current dates, timings and enrolment information.
For enquiries:
Email: info@educoratechnologies.com
Phone / WhatsApp: +91 9518776719
Frequently Asked Questions About Becoming a Data Analyst
1. Can I become a Data Analyst without coding experience?
Yes. Start with Excel, basic analysis and SQL. Once you understand data and reporting concepts, learn Python for more flexible analysis and automation.
2. Is Excel enough to become a Data Analyst?
Excel is valuable for reporting and analysis, but SQL and a business intelligence tool such as Power BI can prepare learners for a broader range of analytical tasks.
3. Should I learn SQL or Python first?
For many beginners interested in reporting and entry-level analytics, learning SQL before Python is a practical approach. SQL introduces working with structured business data, while Python adds programming flexibility.
4. Is Power BI important for Data Analytics?
Power BI is useful for data modeling, interactive dashboards and business reporting. Some organizations use Tableau or other BI tools instead.
5. Can BCom or BBA graduates learn Data Analytics?
Yes. Commerce and business graduates can apply their understanding of business metrics while learning Excel, SQL, Power BI, statistics and Python.
6. What projects should beginners include in their portfolio?
A useful starting portfolio may include an Excel reporting workbook, SQL analysis project, Power BI dashboard and Python exploratory analysis notebook.
7. How long does it take to learn Data Analytics?
Initial foundations can be developed over several months of structured learning and regular practice. Independent analytical proficiency and job readiness may require additional experience.
8. Is advanced mathematics necessary for Data Analytics?
Many beginner-level roles place greater emphasis on arithmetic, percentages, descriptive statistics and interpreting data. Specialized analytics positions may require deeper mathematical knowledge.
9. Is Python compulsory for every Data Analyst job?
Not necessarily. Some reporting-oriented roles emphasize Excel, SQL and BI platforms. Python is a valuable additional skill that expands the types of analytical problems you can address.
10. Can I learn Data Analytics while working or studying?
Yes, provided you have enough time for consistent practice. Choose a learning schedule that allows you to complete assignments and projects rather than only watching lessons.
Conclusion: Start Your Data Analyst Journey with the Right Skills
Becoming a Data Analyst in 2026 requires more than learning software tools.
You need to understand data, solve practical problems, validate your findings and communicate results clearly.
Begin with Excel, build your SQL knowledge, learn Power BI, strengthen your statistical understanding and use Python for more flexible analysis.
Explore AI-assisted workflows carefully while maintaining responsibility for accuracy and data privacy.
Most importantly, develop projects that demonstrate what you can actually do.
The goal is not simply to collect certificates. It is to build the skills needed to transform data into useful business insights.
If you’re looking for a structured learning pathway, explore the Professional Data Analytics Career Program at Educora Technologies.
Learn. Build. Transform.
Educora Technologies — Industry-Focused Technology Training
